
Integrate. Scale. Expand. Grow.
Open, modular, and scalable – i-Vertix grows with your IT and adapts to changing requirements.
Flexible Deployment Options
i-Vertix runs on-premises, in public or private cloud, hybrid, or as SaaS. You decide on operation, control, and data management – without technological limitations.
Appliance-ready & quickly implemented
As a preconfigured virtual appliance, i-Vertix is ready to use immediately. Compatible with VMware, Hyper-V, KVM, Nutanix, and other hypervisors – installation in minimal time.
Distributed Architecture with Smart Pollers
The distributed architecture enables monitoring across multiple locations. Smart Pollers provide load distribution, performance, and fault tolerance without a single point of failure.
Enterprise Scalability
The platform grows with your IT: monitoring of 20,000+ hosts and 500,000+ services possible – ideal for enterprise environments, data centers, and MSP scenarios.
Deploy anywhere. Monitor everything.
- Modular Deployment Framework
- Security by Design
- Encryption & Access Protection
- Secure Monitoring Communication
The right option for every infrastructure
i-Vertix is delivered as a fully preconfigured virtual appliance and can be integrated into existing IT environments in minimal time. The solution supports leading virtualization platforms such as VMware, Hyper-V, KVM, Nutanix, and Sangfor. This allows organizations to deploy i-Vertix independently of their existing infrastructure and scale flexibly. Operating system (Linux) and database (MariaDB) are already integrated and optimally aligned. This reduces installation effort, simplifies maintenance and updates, and ensures a stable, consistent system foundation.
New instances can be deployed quickly, enabling efficient implementation of distributed monitoring architectures. Organizations benefit from rapid implementation, minimal integration effort, and a clearly structured, maintenance-friendly architecture.
Security by Design at system and firmware level
The architecture of i-Vertix consistently follows the principle of “Security by Design.” Already at the firmware level, Secure Boot and UEFI ensure that only authentic and signed software components can be loaded. This prevents manipulated or untrusted components from being executed. Additionally, Security-Enhanced Linux (SELinux) is enabled by default. This security architecture enables very precise control over which processes can access which system resources.
Even if individual components were compromised, strict access control prevents uncontrolled propagation. This multi-layered security strategy strengthens the integrity of the entire system and creates a robust foundation for secure operation of the monitoring platform – even in highly sensitive IT environments.
End-to-end encryption and modern access security
i-Vertix consistently protects communication and access data through modern security mechanisms. All web access occurs via HTTPS with SSL certificates, reliably securing data transmissions. Additionally, communication between Smart Pollers and the Central Manager is fully TLS-encrypted, ensuring monitoring data remains protected even in distributed architectures. Access credentials for monitored systems are stored encrypted and protected from unauthorized access.
Additionally, password complexity policies, multi-factor authentication (MFA), and single sign-on (SSO) provide strong authentication and secure user management. This combination of transport encryption, secure credential management, and modern authentication creates a consistent security level across all system layers.
Efficient and secure monitoring communication
For communication with monitored systems, i-Vertix uses modern and secure protocols such as SNMPv3, SSH, and WinRM. WinRM in particular replaces classic RPC/DCOM mechanisms for Windows monitoring and uses HTTPS-based communication that requires only a single open port. This simplifies network architecture, reduces the attack surface, and simultaneously improves scalability. Fewer open ports mean lower complexity in firewall rules and higher connection stability.
Additionally, Fail2ban protects the system from brute-force attacks by automatically blocking IP addresses after repeated failed attempts. This architecture ensures reliable, high-performance, and secure data collection – even in large and complex IT landscapes.
Monitoring & Observability: Enterprise-ready
700
monitored vendor technologies
5.000
integrated sensor profiles
100.000
captured services
Book a demo now
No theory. Just real insights. Experience i-Vertix live – built around your questions, your environment, and your goals.

Request a non-binding quote
Get a clear picture of how i-Vertix makes your IT more secure and powerful – completely without obligation and tailored to your needs.

Subscribe to Newsletter
Stay up to date: Webinar dates, events, trade fair tickets, new releases, customer experiences, and more, delivered directly to your inbox.

Cisco Meraki Monitoring 🌐 Performance, utilization, VPN, port status & device health
Cisco Meraki Monitoring 🌐 Discovery, performance & events at a glance
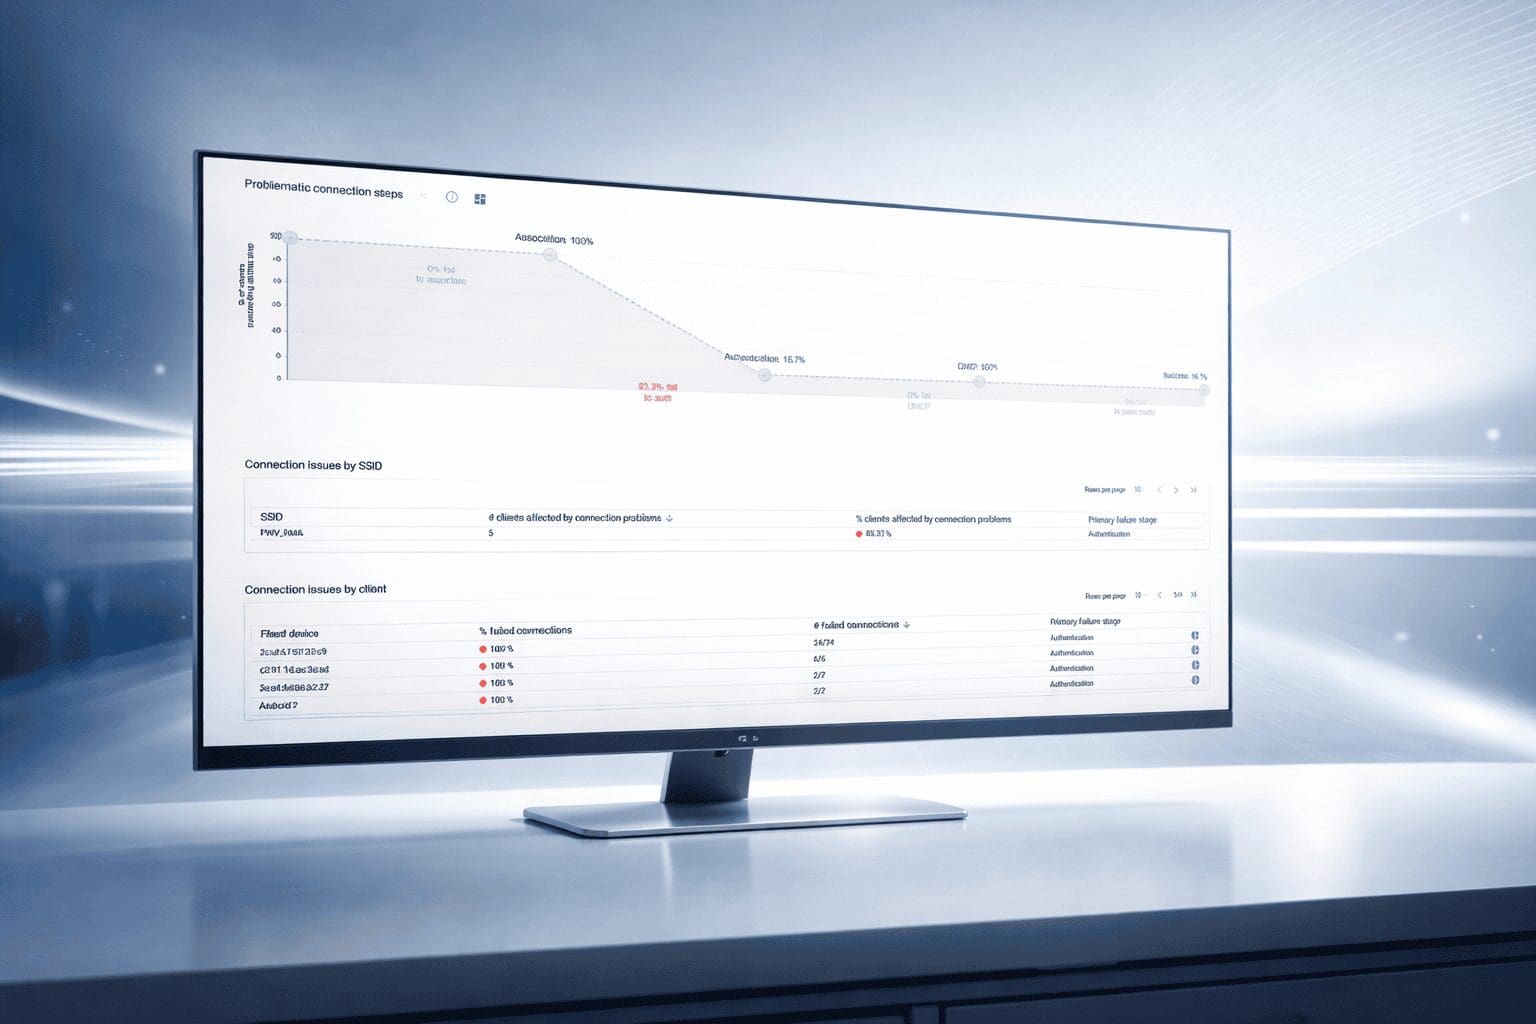
Meraki Monitoring 🌐 Discovery, performance & events at a glance
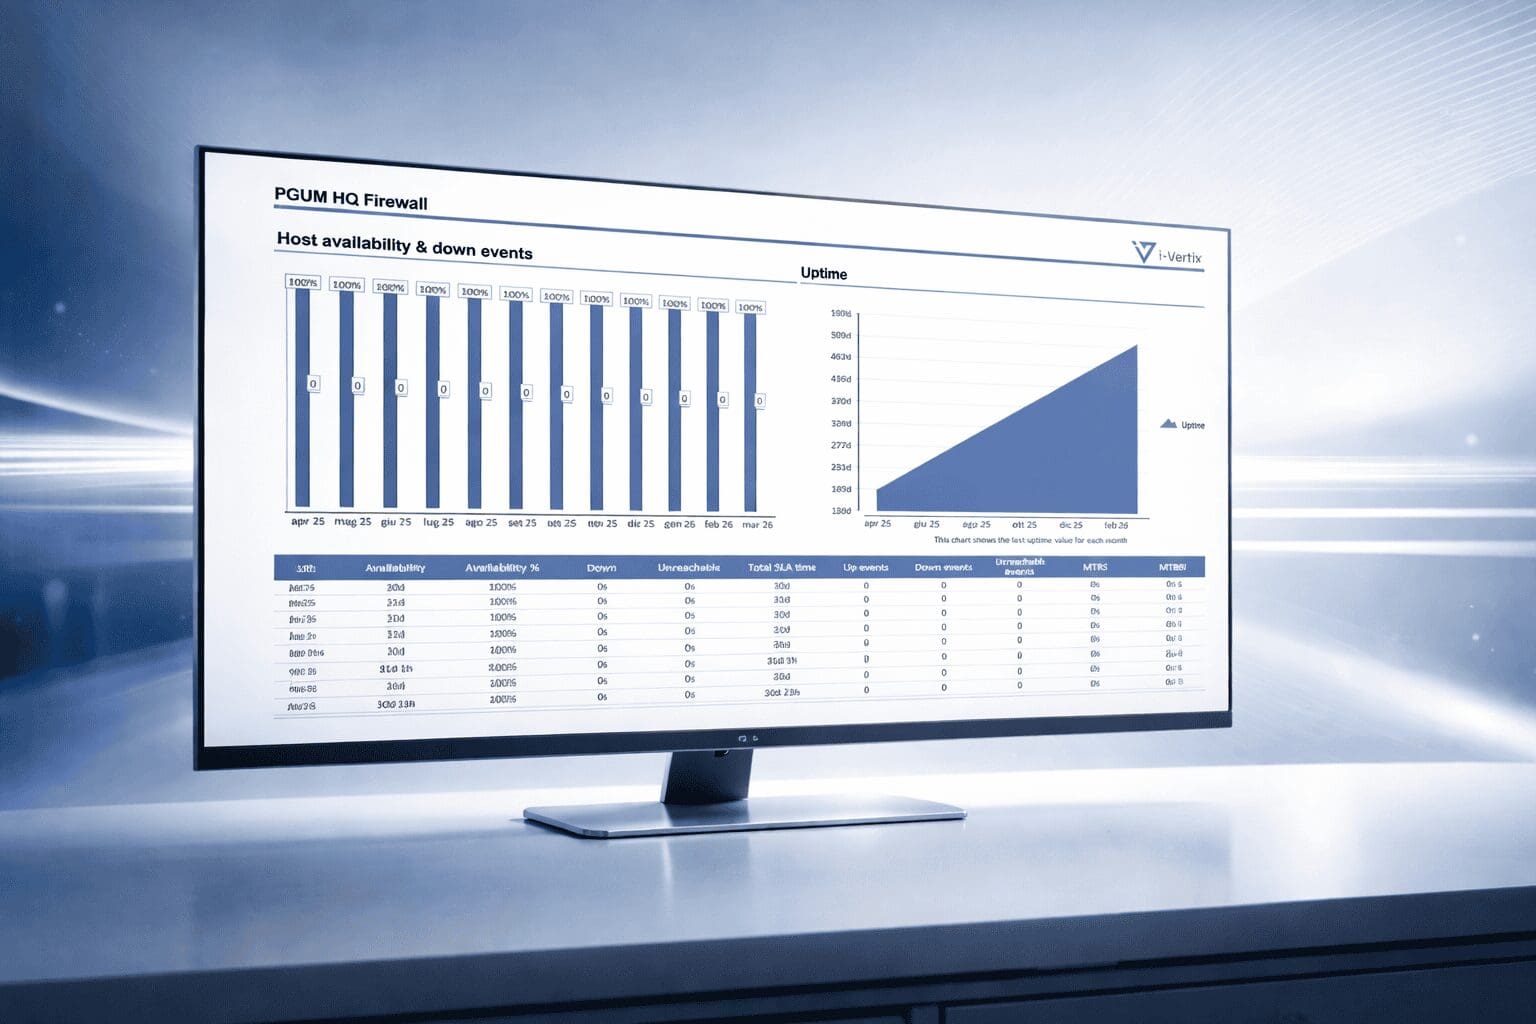
Network Monitoring 🌐 Dependency mapping & predictive performance monitoring
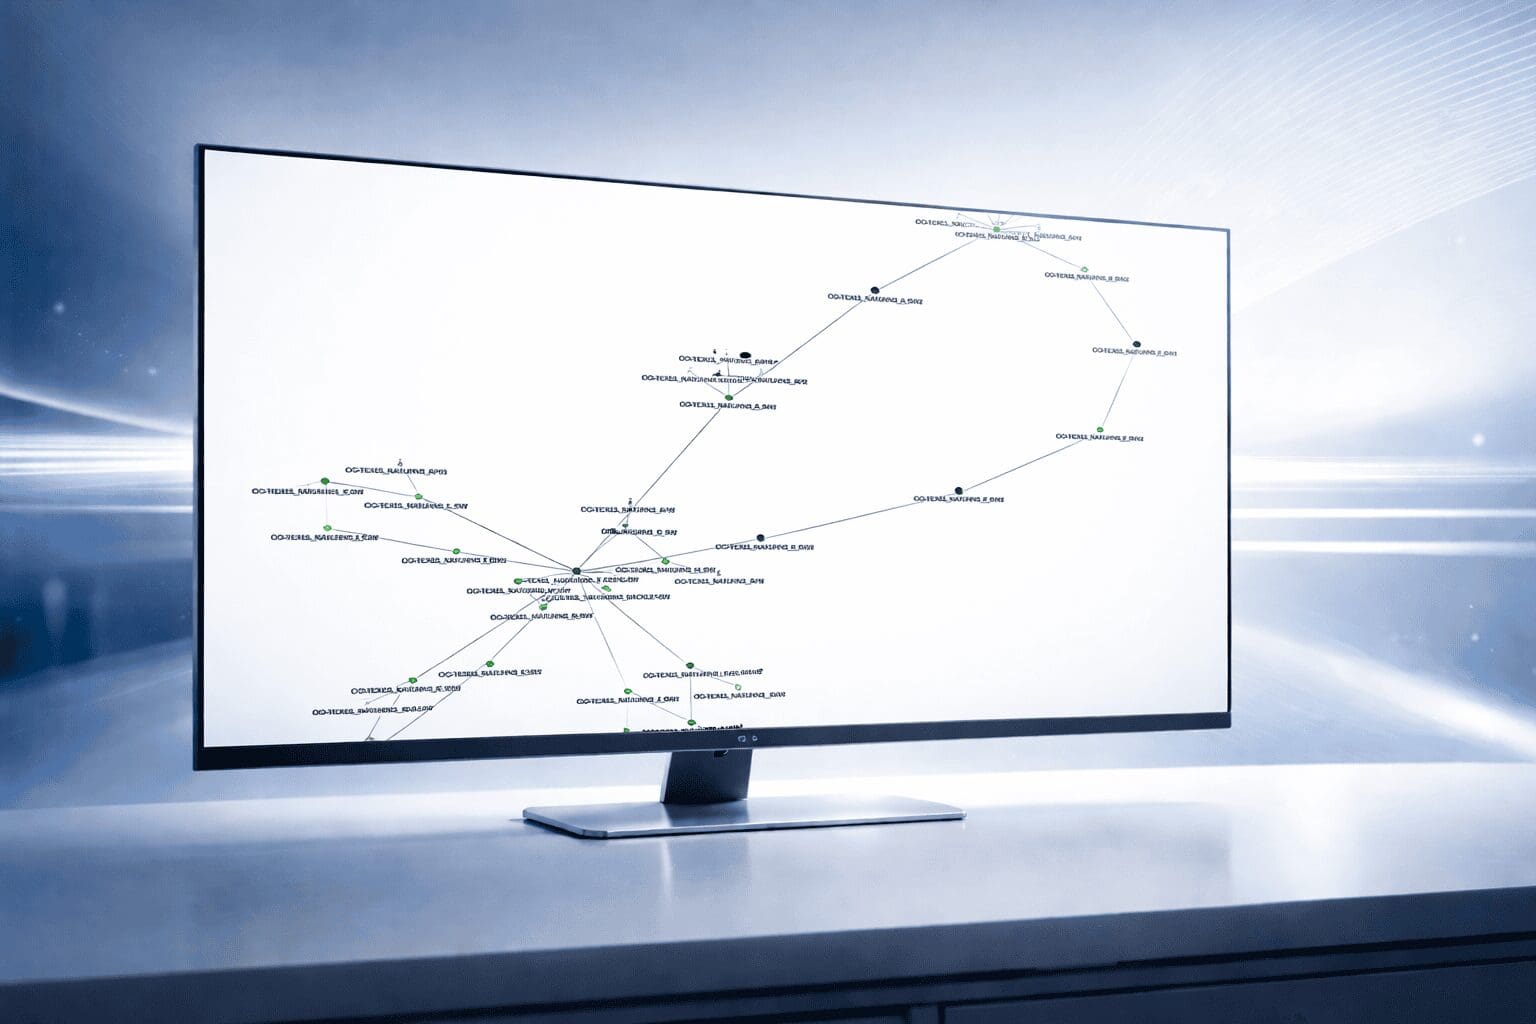
Automated Topology Mapping 🌐 Traffic correlation & SLA-oriented performance monitoring
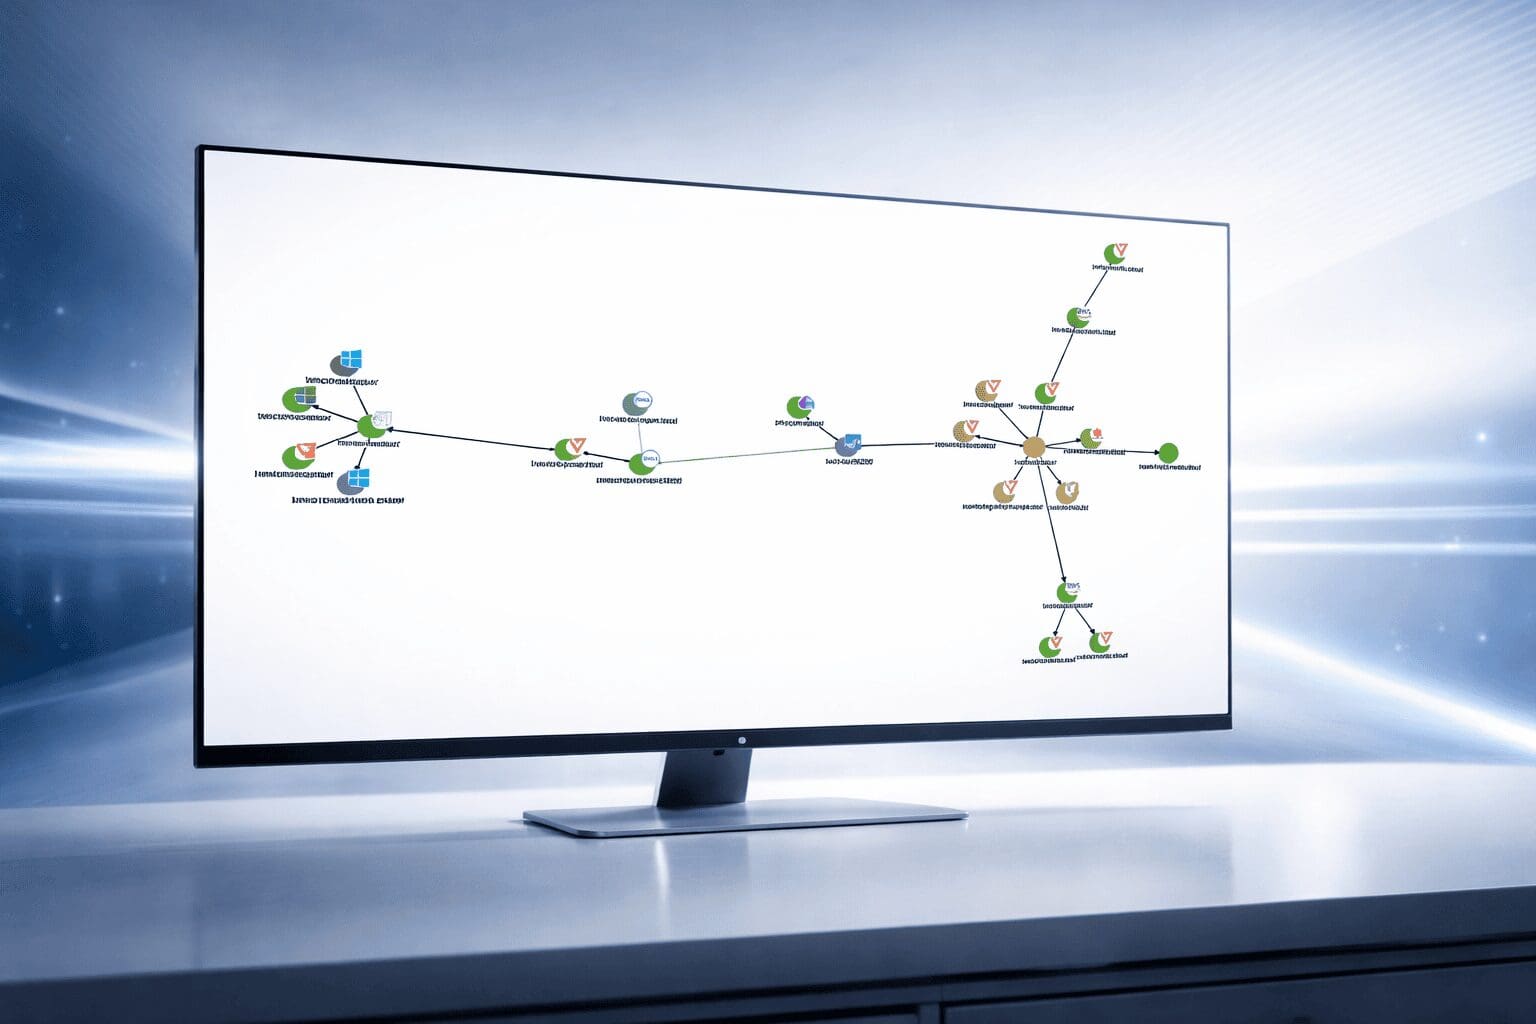
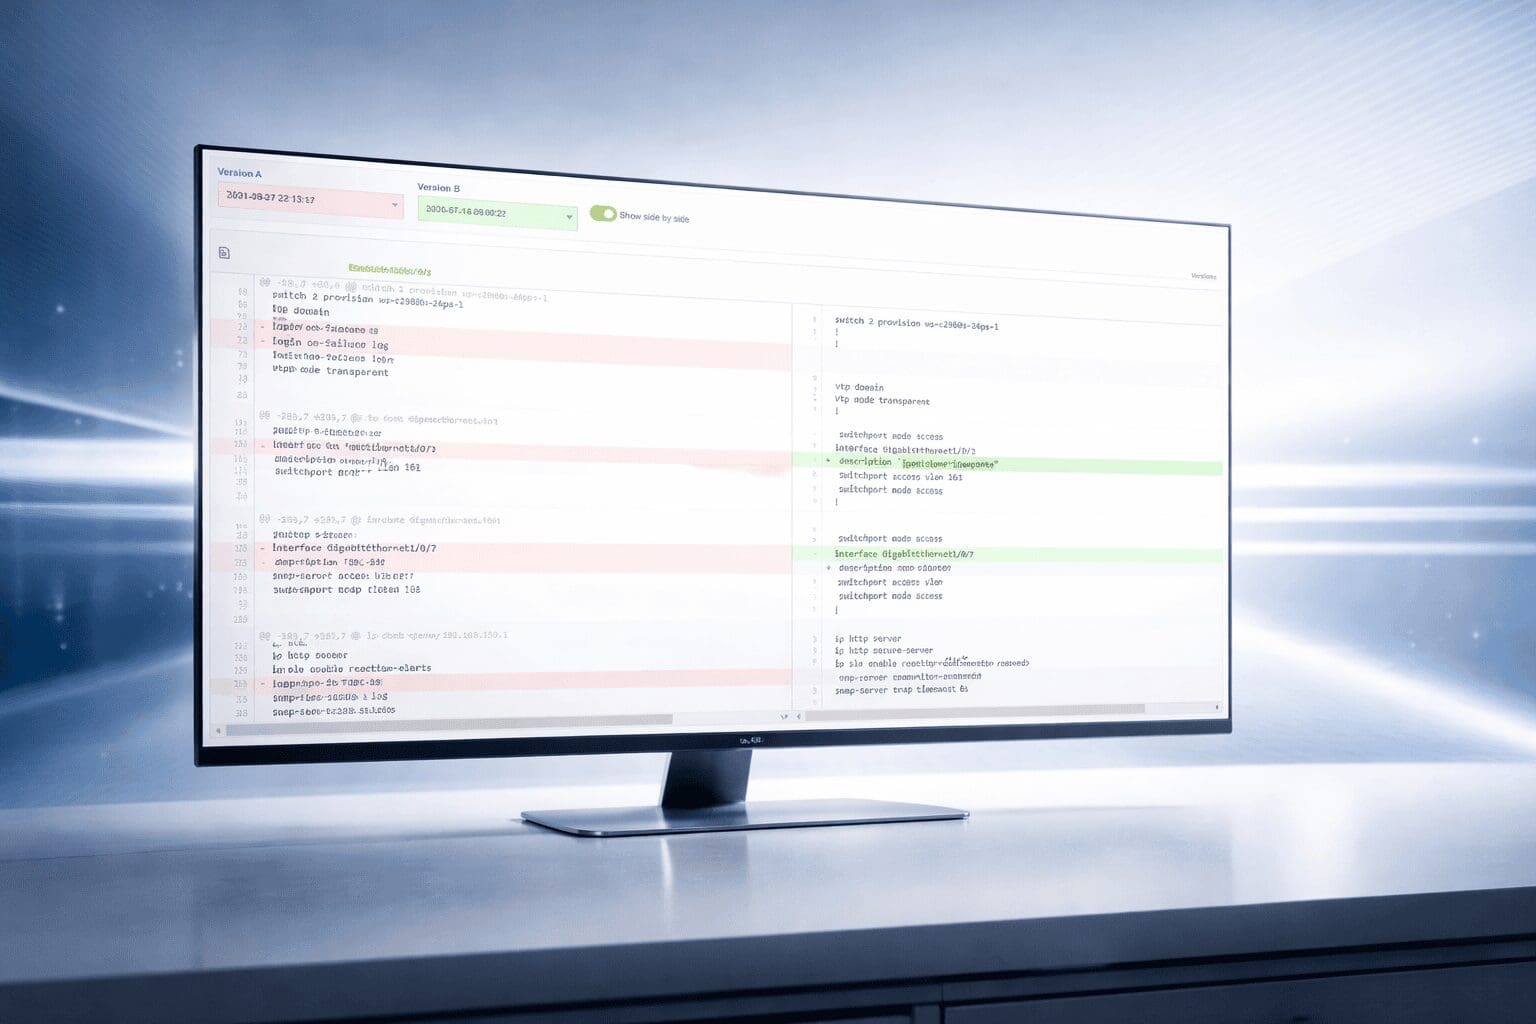
Automated Config Backup & Compliance Monitoring 🌐 Versioning, rollback, anomaly detection
 Made in Europe