
At i-Vertix, IT monitoring means far more than just collecting metrics and triggering alarms. Our platform starts precisely where the daily work of IT managers begins: with the specific questions that are crucial for day-to-day operations.

Network Monitoring Use Cases
IT made easy: Network and infrastructure monitoring with an eye on latency, bandwidth & bottlenecks
Answers to the questions that truly matter in everyday IT
i-Vertix provides clear, actionable information on key topics such as network stability, bottleneck detection, the impact of issues on applications, services, and end-users, as well as the immediately necessary steps for action. This makes monitoring an active tool for informed decisions and rapid problem-solving.
How do I keep an eye on stability and availability at all times?
With i-Vertix, you keep an eye on your company’s entire infrastructure at all times. The platform continuously monitors physical and virtual components and provides a precise picture of the current status of servers, storage systems, databases, and networks. Bottlenecks or potential outages are detected early, allowing you to react in good time.
The combination of real-time monitoring and historical analysis makes it possible to identify trends and patterns, proactively minimize risks, and sustainably secure the stability of your entire IT landscape.
Your network transparent, traceable, and stable
i-Vertix not only makes your network visible but also fully traceable. All network components, including switches, routers, firewalls, virtual networks, and connections, are continuously monitored.
The platform detects anomalies early, highlights connections between individual components, and provides a comprehensive analysis of network performance – both in real-time and in a historical context. This makes network management more efficient, decision-making more reliable, and root causes of errors more quickly identifiable.
Component Monitoring & Root Cause Analysis
i-Vertix pursues a structured approach that goes beyond mere monitoring: all collected data is analyzed, anomalies are prioritized, and dependencies between systems are clearly visualized. This allows problems not only to be identified but also their causes to be quickly narrowed down.
From observing individual network components to their impact on critical services and end-users – i-Vertix provides the information IT teams need to make informed decisions, resolve performance bottlenecks, and minimize downtime.
Monitoring & Observability: Enterprise-ready
700
monitored vendor technologies
5000
integrated sensor profiles
1000000
monitored services
Cisco Meraki Monitoring 🌐 Network, Traffic and Device Monitoring Performance
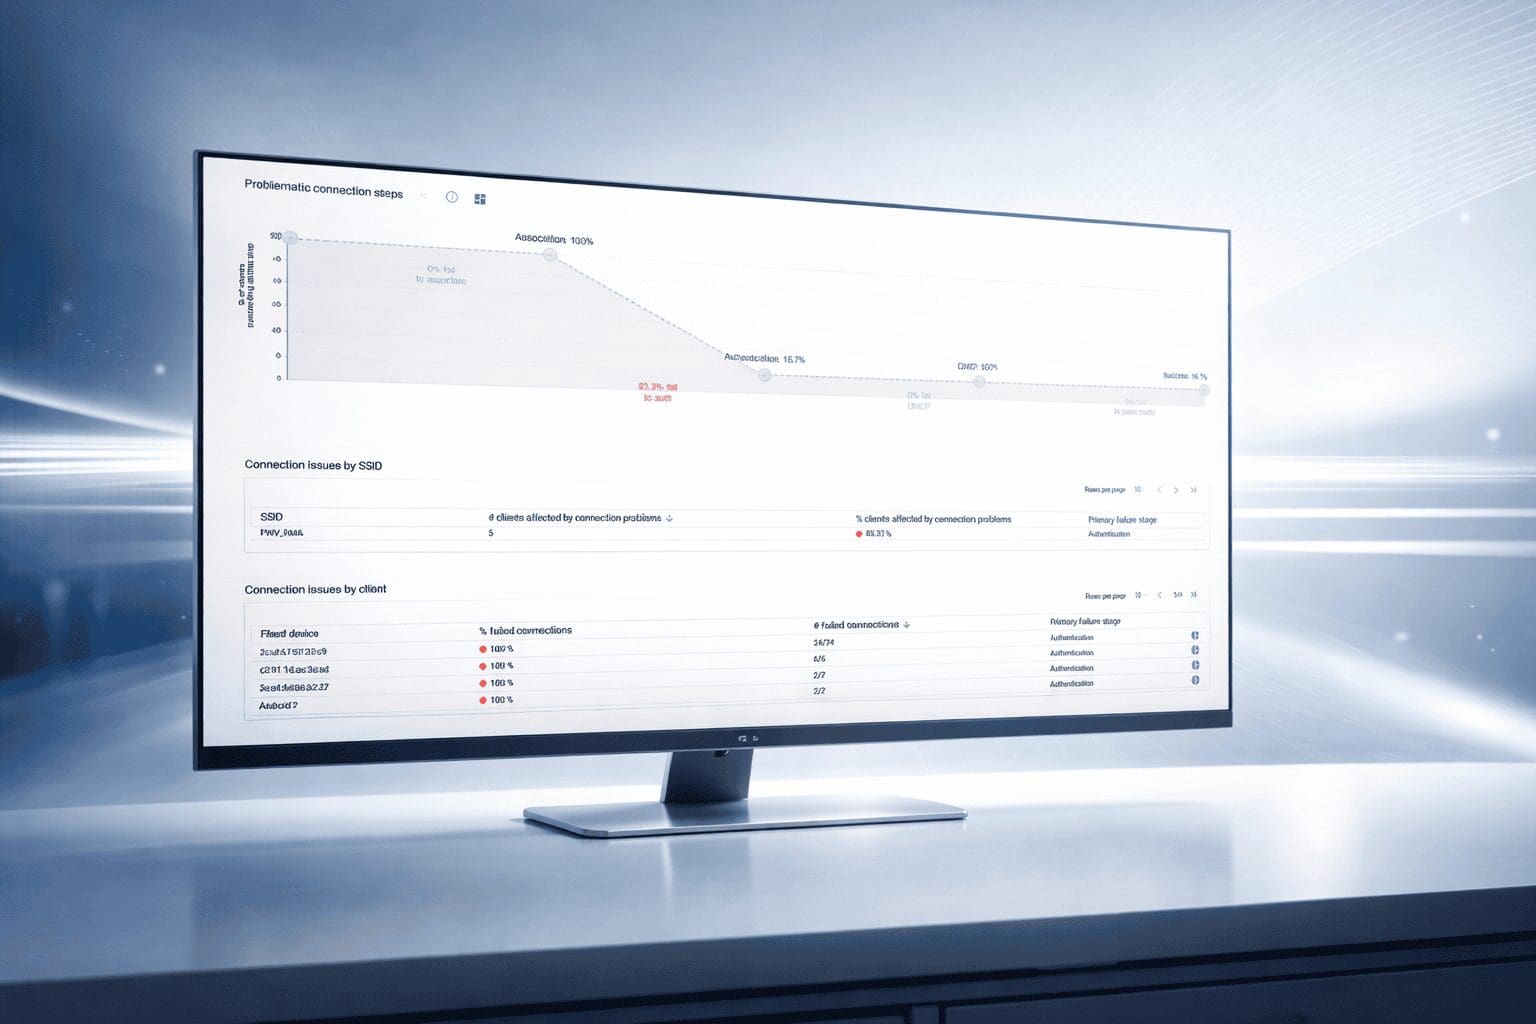
Meraki Monitoring 🌐 Discovery, Performance & Events at a glance
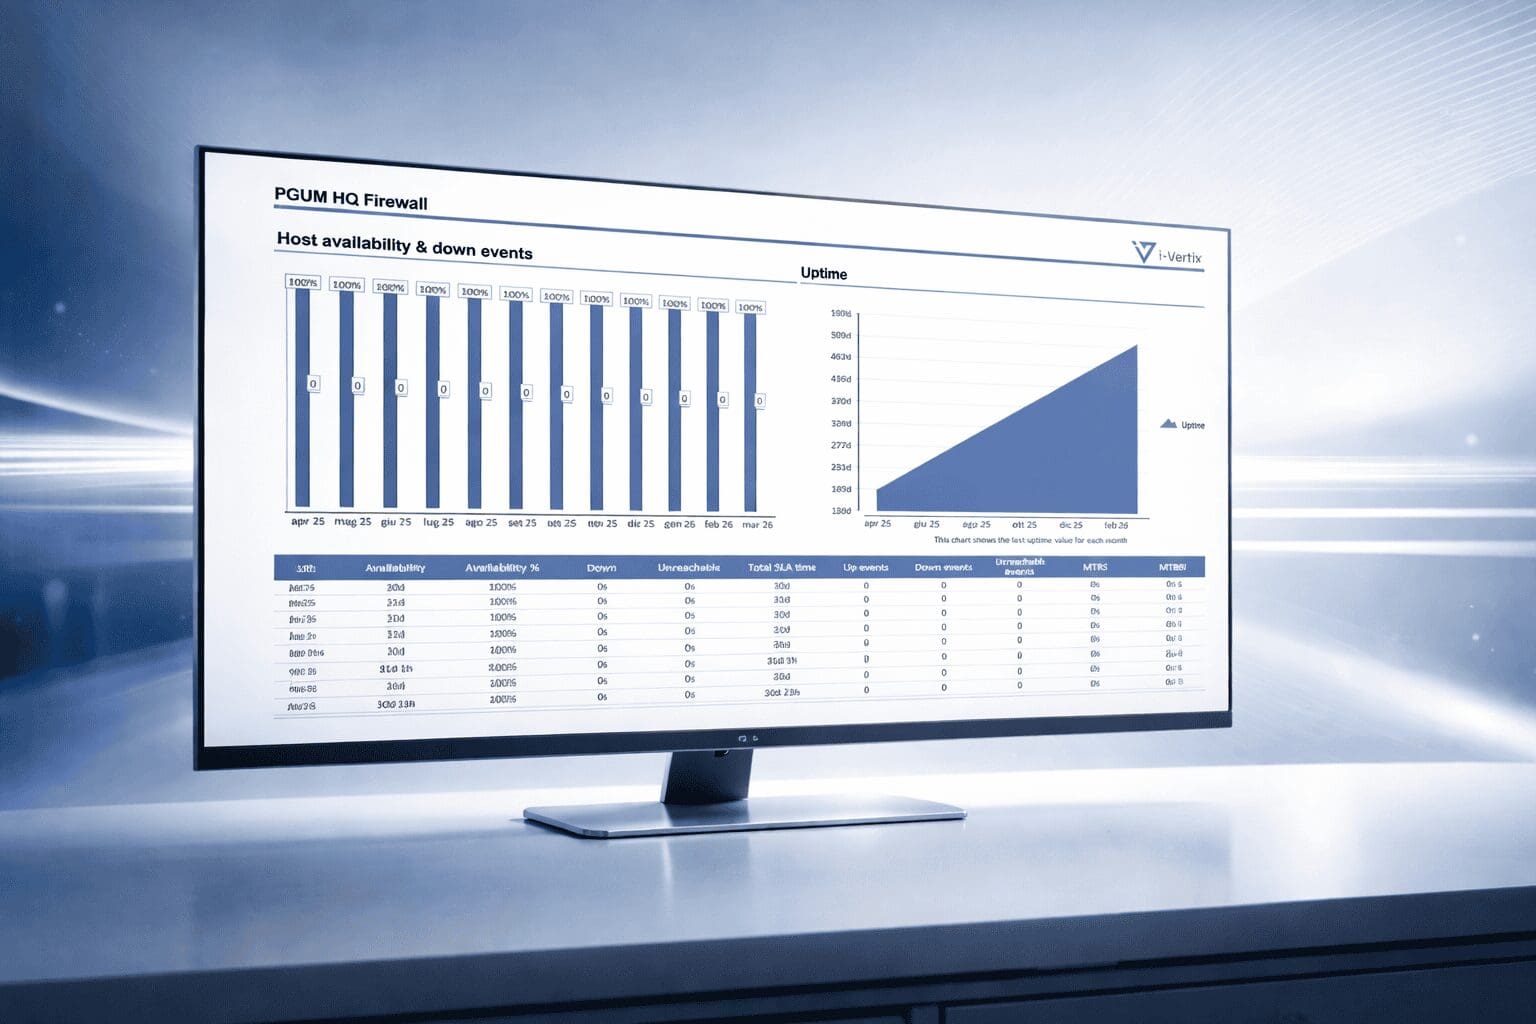
Network Monitoring 🌐 Dependency Mapping & Predictive Performance Monitoring
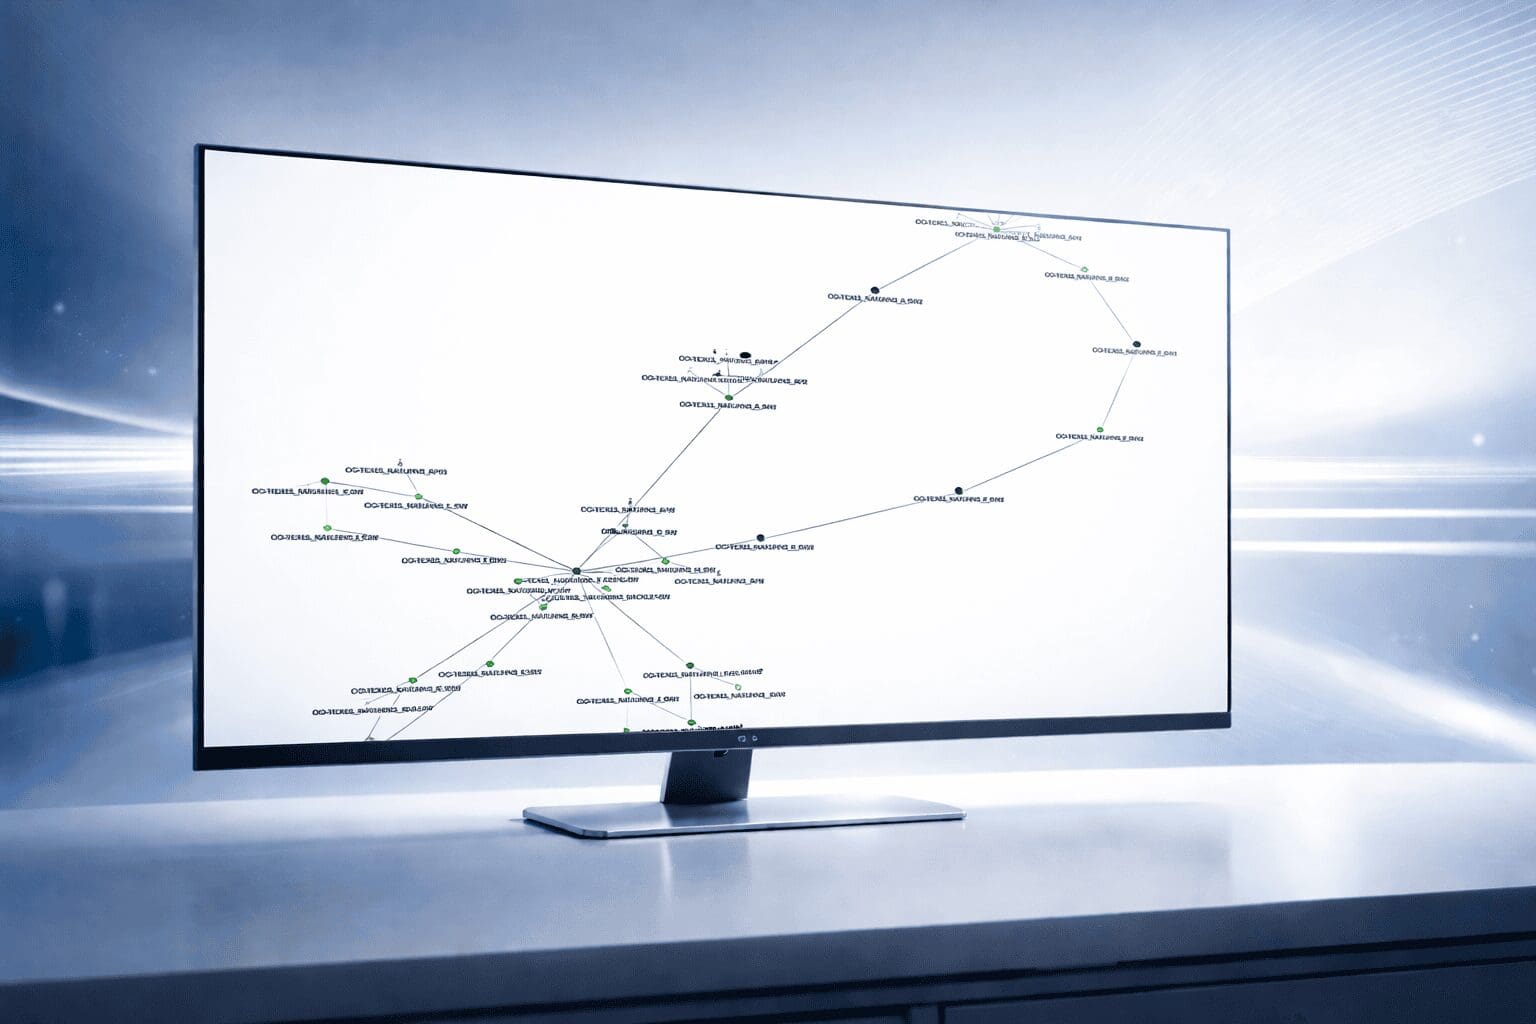
Automated Topology Mapping 🌐 Traffic Correlation & SLA-Oriented Performance Monitoring
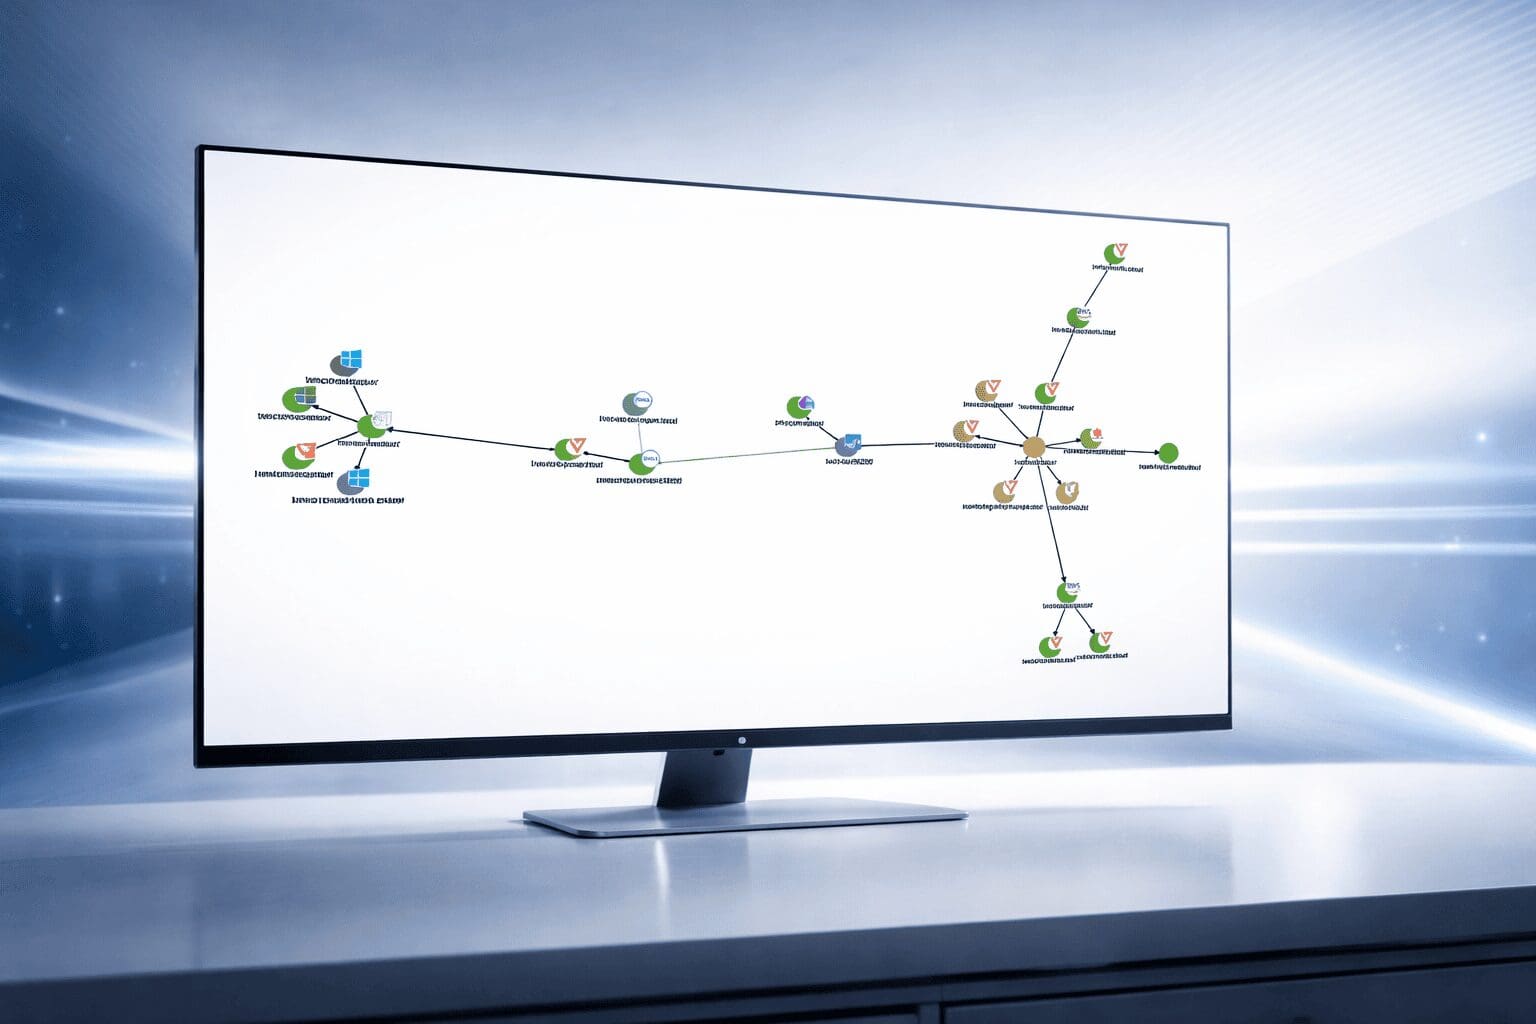
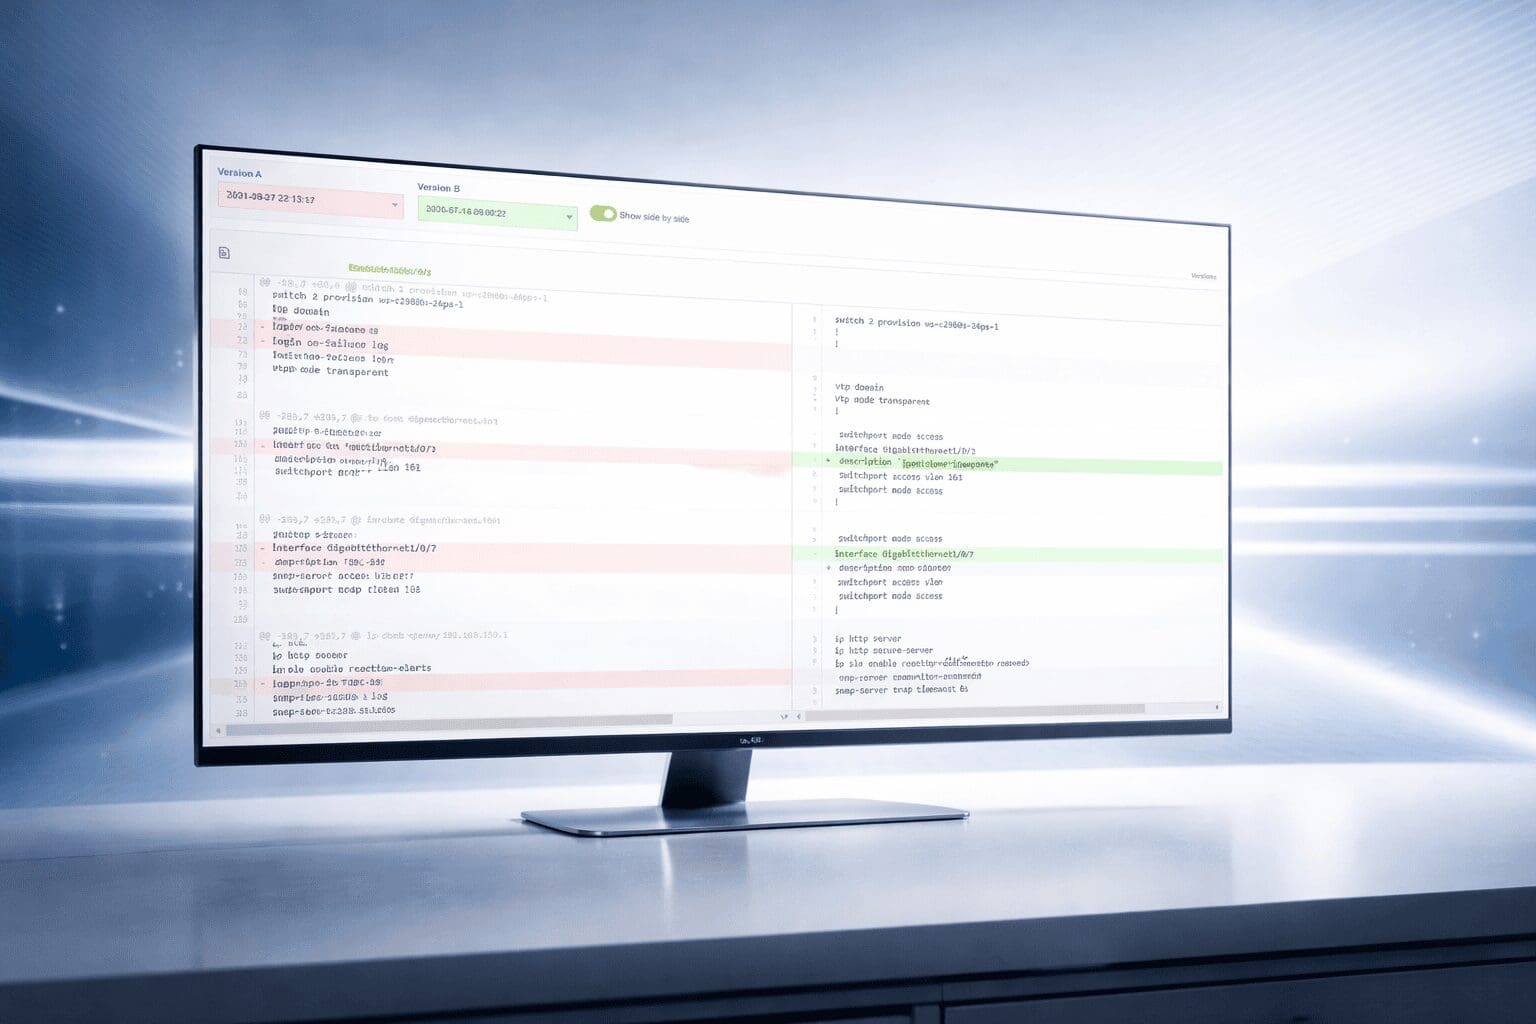
Automated Config Backup & Compliance Monitoring 🌐 Versioning, Rollback, Anomaly Detection
 Made in Europe