Network Monitoring Use Cases

All Devices,

SSIDs & Clients at a Glance

Try for Free Now

Cisco Meraki Monitoring: Network, Traffic & Device Performance
1

Utilization, VPN, Port Status & Device Health

Seamless transparency for cloud-managed networks
Many modern networks are based on Cisco Meraki. i-Vertix integrates these environments directly and makes Meraki infrastructures visible and analyzable in real time – without disruption.
2

i-Vertix monitors and analyzes the following device types, among others:

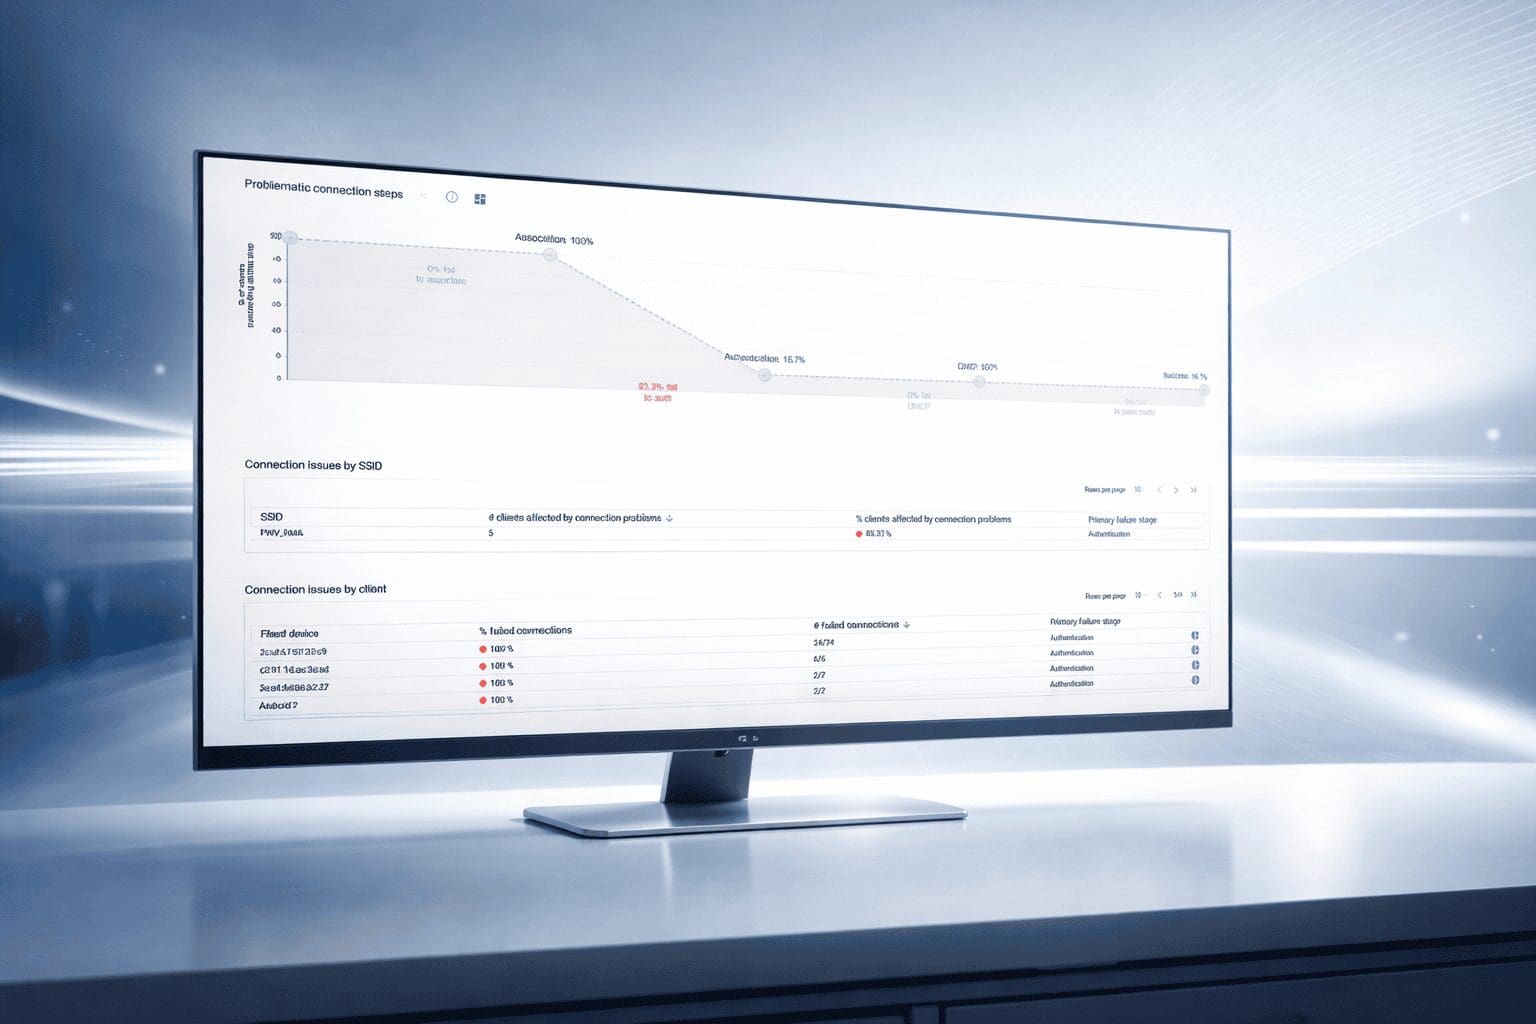
✔️ Access Points (APs) – WLAN availability, client quality, roaming, utilization
✔️ Switches – port status, throughput, errors, bottlenecks
✔️ Security Appliances / Firewalls (MX) – WAN links, VPN status, latencies, packet loss
✔️ Cameras (MV) – device status, availability, system health
✔️ Gateways & other Meraki devices – centrally in a unified view
3

Real-time Dashboards for Meraki Environments

i-Vertix provides real-time dashboards for Cisco Meraki networks that make operational status, performance, and anomalies immediately visible.
You can see at a glance:
✔️ whether WLAN networks are running stably,
✔️ which sites or devices are affected,
✔️ and where performance problems are emerging.

Meraki Monitoring: Discovery & Event Overview
1

Dashboards

i-Vertix provides real-time dashboards for Cisco Meraki networks that make operational status, performance, and anomalies immediately visible.
You can see at a glance:
✔️ whether WLAN networks are running stably,
✔️ which sites or devices are affected,
✔️ and where performance problems are emerging.
2

Discovery & Monitoring

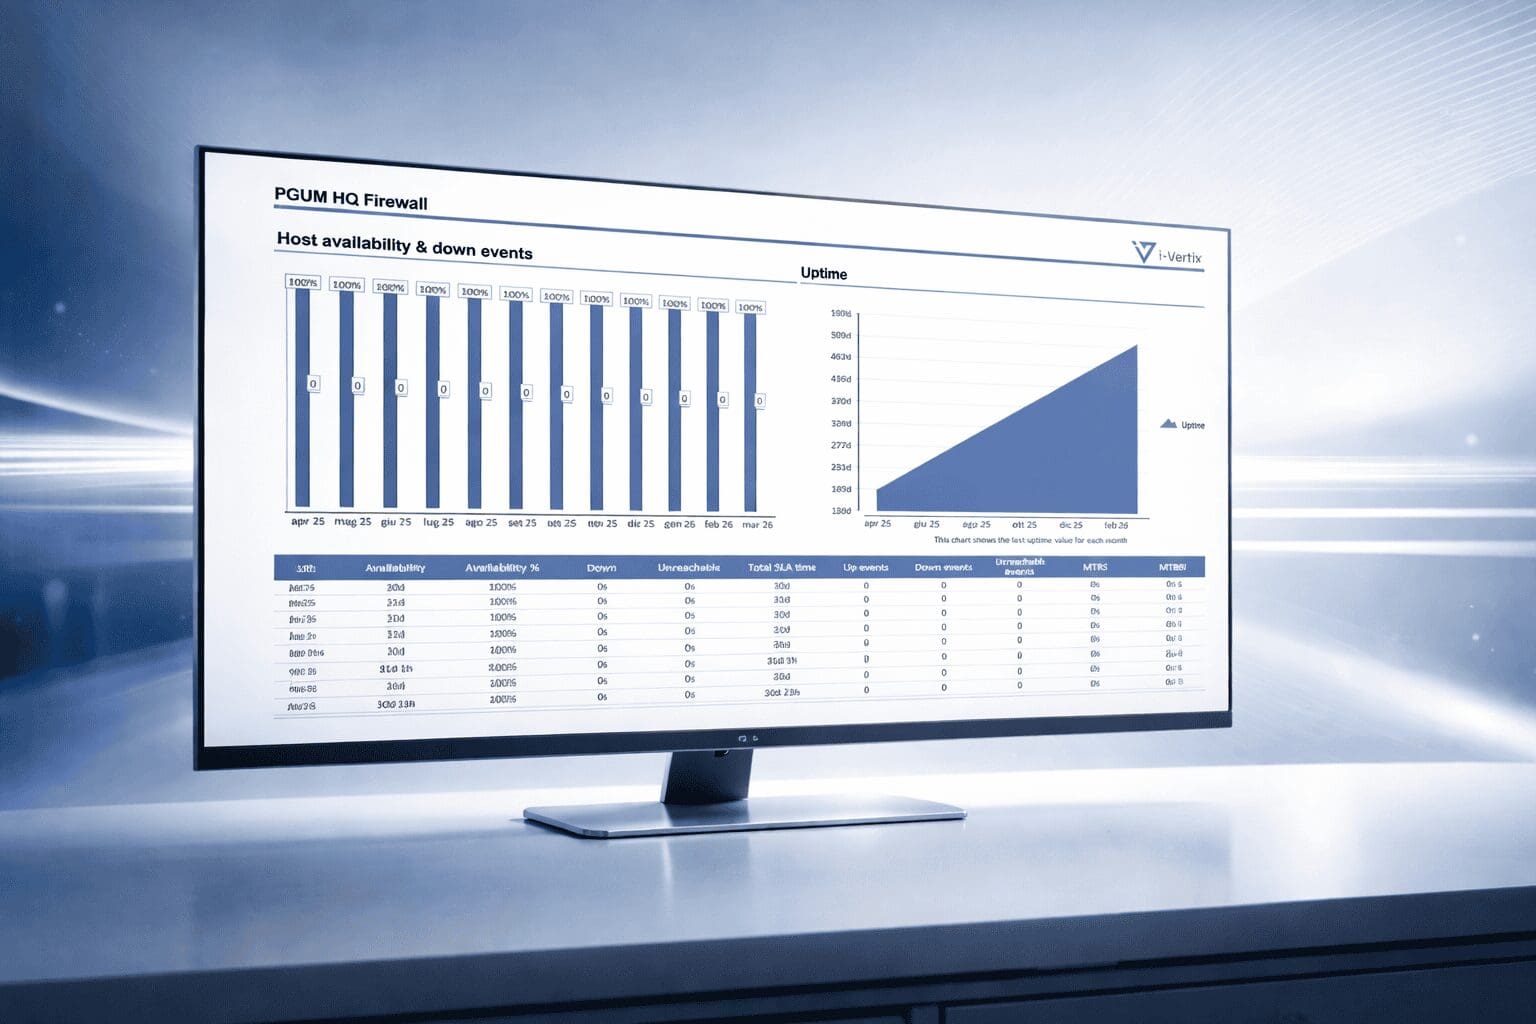
Cisco Meraki devices are automatically discovered and integrated into the central network monitoring.
Topology, status, performance, and events flow into the same analysis and alerting mechanisms as traditional network components.
Cisco Meraki devices are automatically discovered and integrated into the central network monitoring.

📌 The result:
A unified view of hybrid networks – regardless of whether devices are operated traditionally or cloud-managed.

3

Meraki Events in Context

Events from the Meraki environment (e.g., link downs, WAN problems, client issues) are not displayed in isolation, but correlated with topology, traffic, and performance data.
This makes it clear:
✔️ What happened?
✔️ Which systems are affected?
✔️ What impact does this have on applications and users?

Gain complete visibility across complex environments

Network Traffic Monitoring

Gain complete visibility into your network traffic in real time – identify bottlenecks and detect potential issues early to prevent outages and ensure reliable operations.
Observability & Analytics

See beyond alerts – understand relationships, identify anomalies, and uncover root causes across your entire environment.
Network Discovery

All devices and services in the network at a glance – gain full transparency across unknown devices and connected assets.